
Your AI Executive Assistant
Executive Thought Leadership on Autopilot
Sera_01: Semantic Executive Resource Engine
Built for AI Search Visibility
Your Voice, on Every Channel

Business Essentials_
SaaS Capital 2026 median spend by function, why enterprise CMO budgets mislead startups, and the burn multiple and CAC payback tests investors use.
September 22, 2026
8 Min Reads
Morgan Von Druitt
Here's what the median private SaaS company spends on each function, dollar by dollar. The 2026 SaaS Capital survey of more than 1,000 companies found equity-backed firms spend 101% of ARR across all departments. Bootstrapped peers spend 96%. Use those medians as a reference point, not a target. At Dipity, we tell founders to read these numbers as a ceiling on headcount and a floor on systems.
You hit the same wall before every board meeting. The budget looks too big, too small, or both. Nobody on your team knows the right number.
The honest answer lives in three data sets. SaaS Capital shows you the median private company. Benchmarkit shows you the venture-backed spender. Bessemer, Scale Venture Partners, and David Sacks show you the efficiency tests investors run before wiring money. Read together, all three point the same direction.
This guide breaks the numbers down by function. You will see where enterprise figures mislead you. The last section gives you a plan: more money into systems, less into seats. If you are still building your tool layer, start with the minimum viable stack for seed to Series A founders.
The median private B2B SaaS company spends the most on research and development and the least on marketing, per the 2026 SaaS Capital survey. Sales and G&A tie for second. Three functions grew their share of ARR year over year. Marketing and R&D held flat. The 2026 edition doubles as your 2025 comparison.
SaaS Capital updates one page every year. Search for the SaaS Capital spending benchmarks 2025 and you land on the 2026 edition. The 15th annual survey closed in March 2026. Each median sits next to the prior-year figure, so you get both years in one read. Treat the older numbers below as your 2025 column.
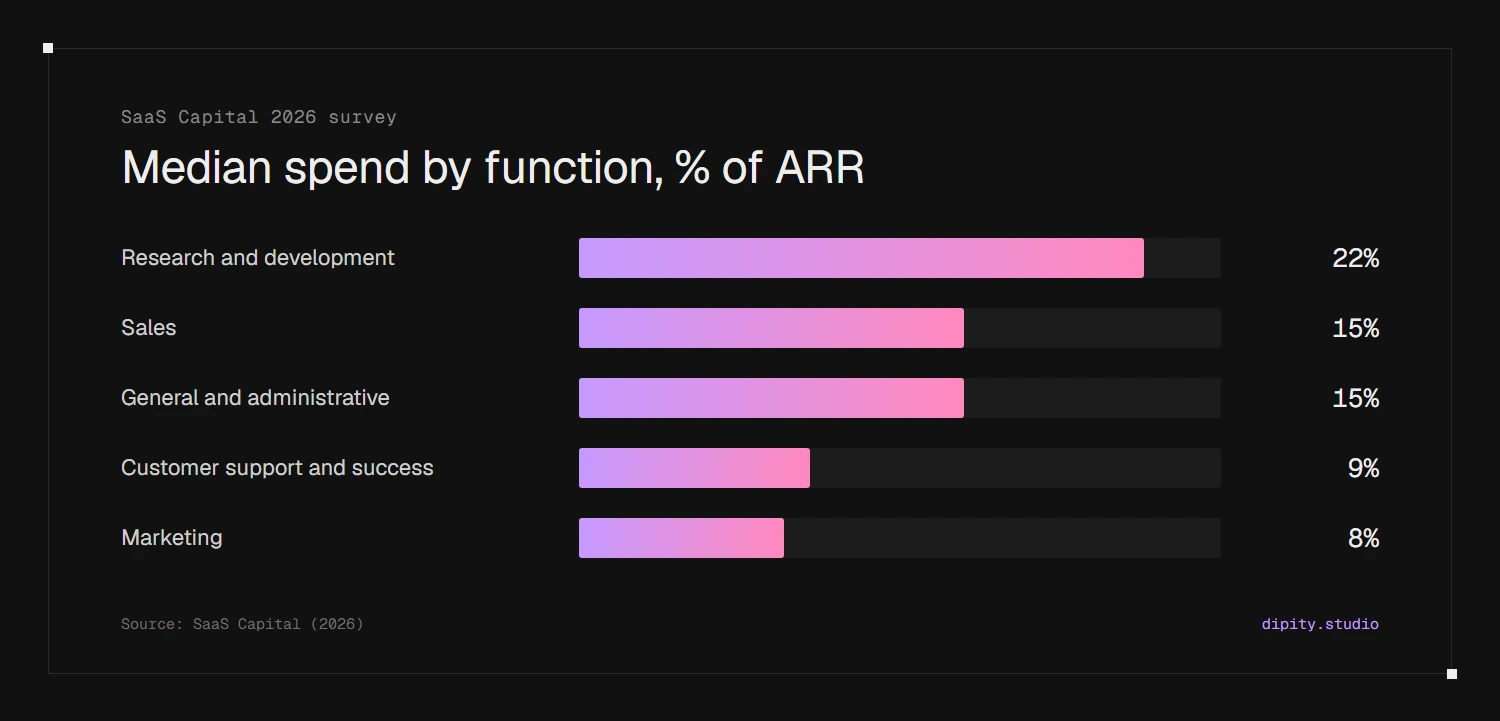
The public page breaks out one revenue band: $3M to $5M ARR, where many Series A companies sit. In SaaS Capital's $3M to $5M ARR band, R&D climbs to 24% of ARR, sales drops to 12%, and customer success rises to 10%. Smaller companies build more and sell less.
Use these medians as a sanity check on your P&L. If sales spend runs well above the median while growth stays flat, you have a conversion problem, not a budget problem.
Extra spend buys a few points of growth. Retention buys far more. Equity-backed companies spend twice as much on marketing as bootstrapped peers and grow at 25% versus 20% at the median. Companies with the highest net revenue retention outgrow any budget line.
SaaS Capital reports equity-backed companies spend "100% more on marketing" than bootstrapped ones. The SaaS Capital growth benchmarks show what the money bought: 25% median growth for equity-backed firms, 20% for bootstrapped firms. You doubled the marketing line and picked up five points of growth. The trade only works when each dollar returns more than a dollar in retained revenue.
Growth got harder across the board. The population median growth rate fell to 22%, down from 25% in 2024. You are spending more in a slower market. Each dollar has to work harder.
Here is the real-world signal. SaaS Capital found companies with the highest NRR report median growth 173% higher than the population median. No spending line comes close to this effect. The KeyBanc and Sapphire Ventures private SaaS survey tells a similar story from the other side: ARR growth expected to accelerate from 15% in 2024 to 20% in 2025, with EBITDA margins on track to cross into profitability in 2026.
Spend follows retention. Fix churn before you add a single seller. Let your customers carry part of the growth load.
Gartner's marketing budget figure comes from CMOs at companies with more than $1 billion in revenue. Your seed-stage marketing budget is mostly founder time plus one or two hires. Percent-of-revenue math means little before roughly $1M ARR. Never paste an enterprise ratio into your startup plan.
Founders quote the Gartner number all the time. MarTech's coverage of the Gartner 2025 CMO Spend Survey reported marketing budgets flat at 7.7% of revenue. The survey pulled from 402 CMOs and marketing leaders, primarily at companies with more than $1 billion in annual revenue. This is a benchmark for global brands with media teams. If you run a 12-person startup, this number has nothing to do with you.
The 2026 update barely budged. Marketing Dive reported Gartner's 2026 figure at 7.8% of company revenue, with 15.3% of marketing budgets on average directed toward AI.
Benchmark against companies your size and funding model. Investors run the same filter. Here is why what investors check before a raise centers on efficiency, not budget size.
Venture-backed SaaS companies spend far more on sales and marketing than the SaaS Capital median suggests. Benchmarkit puts the figure at 47% of revenue for VC-backed firms versus 33% for PE-backed firms. The gap reflects the funding model. Judge your own spend by CAC payback, not by percentage.
These are the sales and marketing spend benchmarks most Series A boards compare against. Benchmarkit's 2025 SaaS performance data shows sales and marketing at 47% of revenue for VC-backed companies. Across the full population, median S&M sits at 37% of revenue, and the median company spends about $2.00 in S&M for every $1.00 of new customer ARR.
Efficiency slipped over the same stretch. Benchmarkit found CAC payback has increased 12.5% at the median since 2022. The good news sits in the 2026 data. ICONIQ's State of Go-to-Market 2026 found free trial and proof-of-concept conversion rates jumped to roughly 50% in 2026, up from about 36% in 2025, and sales cycles shortened by about six weeks.
Bessemer's CAC payback targets remain the standard reference, even though the guidance dates from 2021. Bessemer's "Scaling to $100 Million" notes "only after the CAC payback period expires" do customers become profitable.
A high S&M percentage is fine if payback stays inside the target for your segment. A low percentage with a 30-month payback is still a leak.
Efficient growth means every dollar of net burn buys you a strong return in new ARR. David Sacks defines burn multiple as net burn divided by net new ARR. Lower is better. Scale Venture Partners found the fastest-growing companies also post the lowest burn multiples in their ARR band.
The formula is dead simple. David Sacks wrote "Burn Multiple = Net Burn / Net New ARR." Under 1x means you add more ARR than you burn.
Speed and efficiency are not a trade-off. Scale Venture Partners' benchmarking found "higher growth (top decile / quartile) companies have the best (lowest) Burn Multiples within their ARR band." The same research concluded only efficient companies sustain high growth over time.
Here is a concrete example. A company burns $2M in a year and adds $1M in net new ARR, for a burn multiple of 2x. Cut burn to $1M with the same ARR gain, and the multiple drops to 1x.
High Alpha, which now runs the benchmark series OpenView started, backs this up with data from more than 800 survey respondents. Companies pairing high NRR with low CAC nearly double their growth rates and Rule of 40 scores. SaaS companies with AI deeply built into the product grow twice as fast as peers across every ARR band.
Track burn multiple monthly, next to CAC payback. Those two numbers tell your board more than any budget percentage.
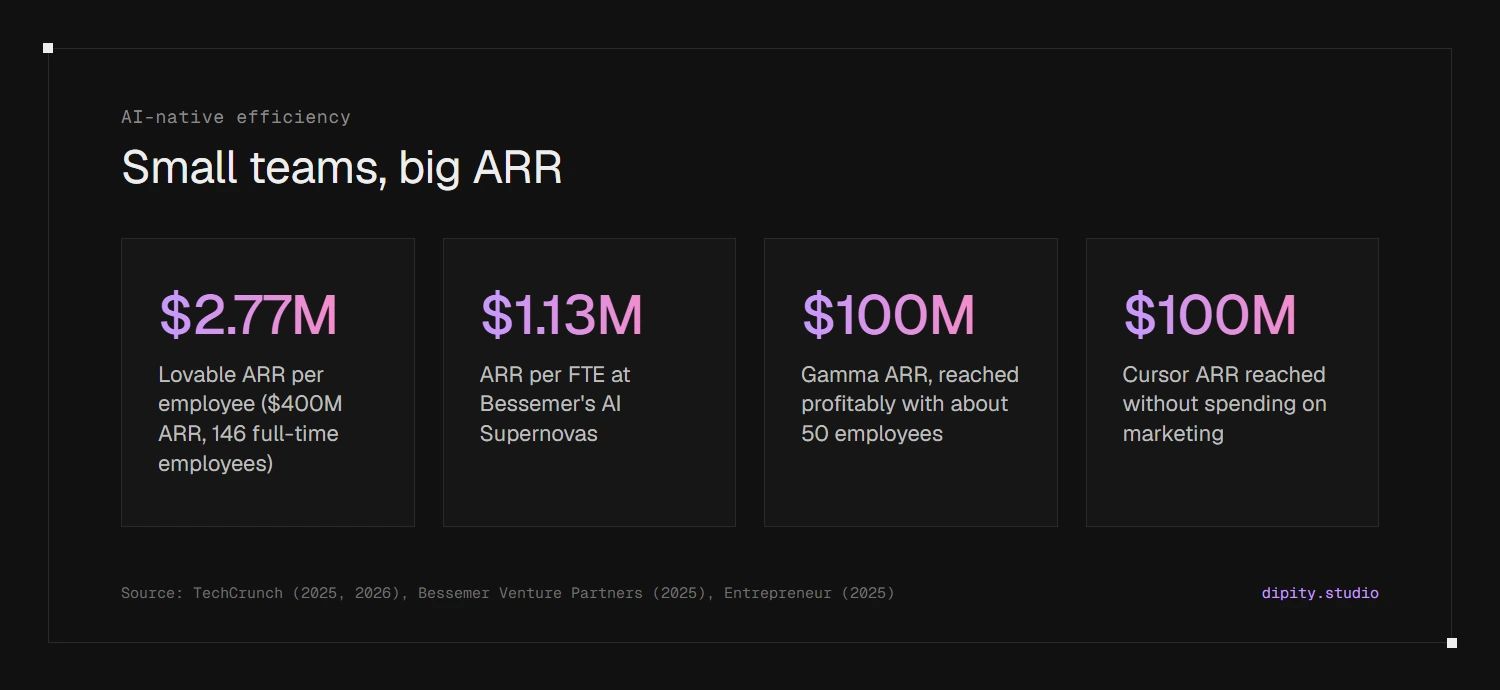
AI-native companies are rewriting the revenue-per-employee playbook. Bessemer's fastest AI startups average $1.13M ARR per full-time employee. Lovable, Gamma, and Cursor each crossed $100M ARR with small teams and product-led or founder-led distribution before spending a dollar on brand media.
Bessemer's State of AI 2025 splits AI startups into two camps. Supernovas hit about $40M ARR in year one with $1.13M ARR per FTE, but gross margins hover near 25% and often go negative. Shooting Stars reach about $3M ARR in year one with gross margins near 60%. Bessemer expects hundreds of Shooting Stars. For most seed founders, those are the realistic model to study.
Three companies prove the pattern. Entrepreneur, citing Bloomberg, reported Cursor hit $100M in ARR "without spending a dime on marketing" and passed one million users. TechCrunch reported Lovable reached $400 million in ARR in February 2026 with only 146 full-time employees. The math: $2.77 million in ARR per employee. Lovable only launched "Earworm," a paid brand campaign across social platforms, YouTube, and connected TV, after reaching scale.
Gamma follows the same playbook. TechCrunch reported Gamma "profitably hit $100 million in ARR" with about 50 employees, 70 million users, and roughly $90 million raised in total.
These companies bought distribution with product and founder voice before they bought media. Your face and your point of view do the work a paid budget does for everyone else. Here is why your face is the best go-to-market channel for an AI startup.
Put budget into systems, not seats. Capture founder and executive expertise once. Turn those methods into playbooks and SOPs. Let AI agents run the repeatable work. People own judgment and review. Systems own volume.
Headcount is the most expensive way to scale output. Every new hire adds salary, ramp time, and management load. Early hires often walk out the door with the playbook in their heads. Systems keep the knowledge inside the company. Playbooks over heroics.
Content is the clearest place to start. Founder expertise drives pipeline at this stage, yet most founders never find the hours to write. Founder-led content as a growth channel works when a system captures the founder's thinking and ships posts on schedule.
Hire for judgment. Buy systems for volume. Do more with less, and keep your burn multiple honest while you grow.
Pull the SaaS Capital medians first. Compare your S&M line against peers who share your funding model. Judge every dollar by CAC payback and burn multiple. Keep headcount lean. Build systems your first hires plug into. Let founder voice carry distribution.
Pull your trailing 12-month spend by function. Divide each line by ARR. Flag any function running far above the median. Ask what growth the extra spend bought. Then calculate CAC payback by segment and burn multiple for the last four quarters.
Next, turn one hiring plan into a systems plan. Content is the easiest first move. Founders are becoming the product, and an authority content engine compounds without adding seats. Authority beats activity every quarter.
Turn founder expertise into a system. Start with Sera to interview your executives and publish in their voice. Or see how the platform works on the Dipity product page.
There is no universal percentage. B2B SaaS marketing spend as a share of revenue shifts based on your funding model. The SaaS Capital median for marketing alone sits well below the combined sales and marketing figures venture-backed firms report. Set your budget by CAC payback for your segment. Grow spend only while payback holds.
The 2026 report shows selling costs rising year over year while marketing held flat. Median combined S&M lands in the low 20s as a percent of ARR. Equity-backed companies outspend bootstrapped ones on marketing by a wide margin. Growth differences between the two groups are much smaller.
Bessemer's targets depend on segment. The shortest window is for SMB. The longest is for enterprise. Shorter is always better because customers become profitable only after payback. Benchmark against your own segment, not an average.
Lower is better. Burn multiple is net burn divided by net new ARR. A multiple under 1x means you add more ARR than you burn. Scale Venture Partners found the fastest growers post the lowest multiples in their ARR band.
VC-backed companies spend far more. SaaS Capital shows equity-backed companies outspend bootstrapped peers on marketing by a wide margin. Benchmarkit shows VC-backed firms outspending PE-backed firms on S&M by 14 points of revenue.
No. The Gartner survey covers CMOs at companies with more than $1 billion in revenue. You should benchmark against private SaaS peers at your own stage and funding model.
Benchmarkit. (2025). 2025 SaaS Performance Metrics
Bessemer Venture Partners. (2021). Scaling to $100 Million
Bessemer Venture Partners. (2025). The State of AI 2025
Entrepreneur. (2025). AI startup Cursor gained a million users without spending on marketing
High Alpha. (2025). 2025 SaaS Benchmarks Report
ICONIQ Growth. (2026). State of Go-to-Market 2026
KeyBanc Capital Markets. (2025). Private SaaS Company Survey Reveals AI-Driven Transformation and Sustained Operational Excellence
Marketing Dive. (2026). AI remains a top priority for CMOs, but spending lags: Gartner
MarTech. (2025). CMOs brace for cuts as marketing budgets stay flat
SaaS Capital. (2026a). 2026 Private B2B SaaS Company Growth Rate Benchmarks
SaaS Capital. (2026b). 2026 Spending Benchmarks for Private B2B SaaS Companies
Sacks, D. (2020). The Burn Multiple
Scale Venture Partners. (2022). Benchmarking SaaS Growth and Burn
TechCrunch. (2025). AI PowerPoint-killer Gamma hits $2.1B valuation, $100M ARR, founder says
TechCrunch. (2026). Lovable says it added $100M in revenue last month alone with just 146 employees

Looking for further details?






Our experienced team values clarity and craftsmanship, excelling in production systems.